CUET Preparation Today
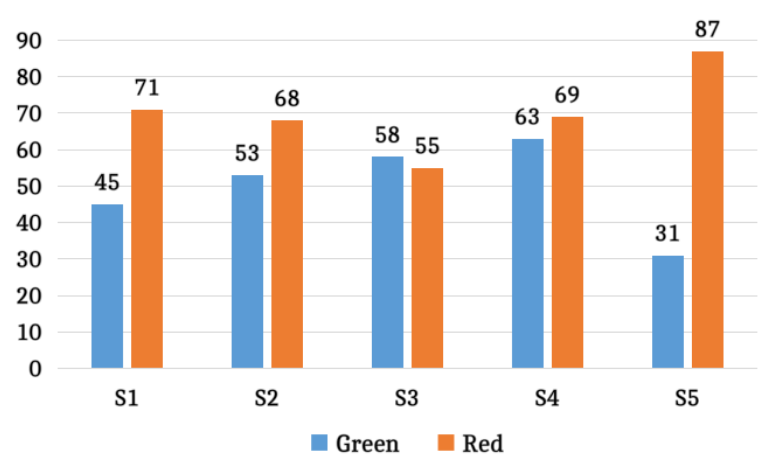
The following bar chart shows the number of bottles of green and red colours sold by 5 different shops.
What is the ratio of the total number of green bottles sold by the 5 shops taken together to the total number of red bottles sold by the 5 shops taken together? |
3 : 5 6 : 11 4 : 7 5 : 7 |
5 : 7 |
Total number of green bottles sold : Total number of red bottles sold ( 45 + 53 + 58 + 63 + 31 ) : ( 71 + 68 + 55 + 69 + 87 ) 250 : 350 5 : 7 |