CUET Preparation Today
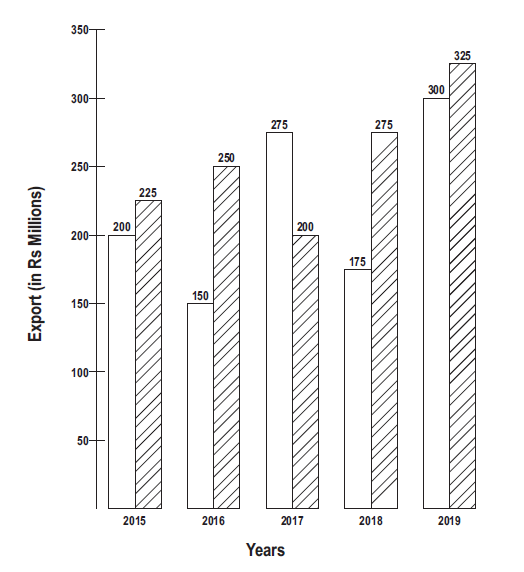
The bar graph shows the exports of Jeeps of type A and type B (in Rs. Million) from 2015 to 2019. A → Blank candles B → Line candles
Find ratio of average of export of Jeep of type A and average of export of Jeep of type B? |
33 : 57 19 : 21 44 : 51 51 : 44 |
44 : 51 |
Total export of Jeep of type A = 200 + 150 + 275 + 175 + 300 = 1100 Average → \(\frac{1100}{5}\) = 220 Total export of Jeep of type B = 225 + 250 + 200 + 275 + 325 = 1275 Average → \(\frac{1275}{5}\) = 255 Ratio → 220 : 255 44 : 51 |