CUET Preparation Today
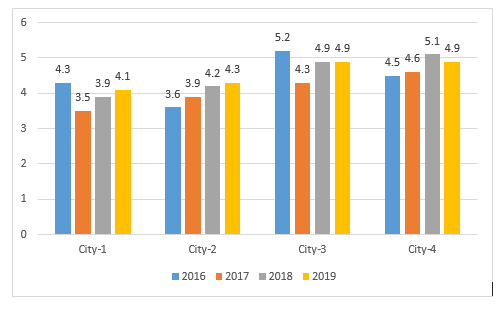
The following graph shows the sales of cars (in thousands) in four cities in 4 years. Study the graph and answer the question.
Which city has the highest percentage of sales, and in which year? |
City-3; 2016 City-4; 2017 City-1; 2019 City-2; 2018 |
City-3; 2016 |
By carefully observing the graph . We find that City 3 has highest sale in year 2016 i.e. 5.2 Ans :- City - 3 ; 2016 |