CUET Preparation Today
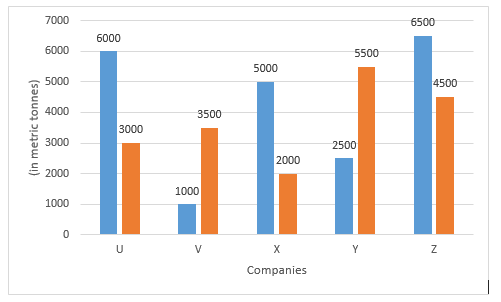
Study the graph and answer the question that follows. The chart represents the demand and production of a certain item (in metric tonnes) for five companies U, V, X, Y and Z.
If p% of the demand of the item for company U is equal to the production for company Z, then p is equal to: |
55 85 65 75 |
75 |
Demand of the item for company U = 6000 Production for company Z = 4500 ATQ, p% of 6000 = 4500 \(\frac{p}{100 }\) × 6000 = 4500 \(\frac{p}{100 }\) = \(\frac{4500}{6000 }\) p = \(\frac{3}{4 }\) × 100 p = 75
|