CUET Preparation Today
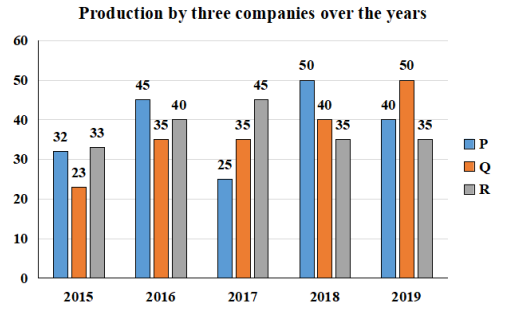
The following graph shows the data of the production of electric wire (in thousand tons b three different companies P, and R over the years.
What is the ratio of the average production of Company Pin the period 2017- 2019 to the average production of Company Q in the same period? |
4 : 5 25 : 23 23 : 25 5 : 4 |
23 : 25 |
Average production of P in 2017 - 2019 : Average production of Q in 2017 - 2019 \(\frac{25+50+40 }{3}\) : \(\frac{35+40+50 }{3}\) \(\frac{115 }{3}\) : \(\frac{125 }{3}\) 23 : 25 |