
Study the given graph and table and answer the following question.
Data of different states regarding population of states in the year 1998
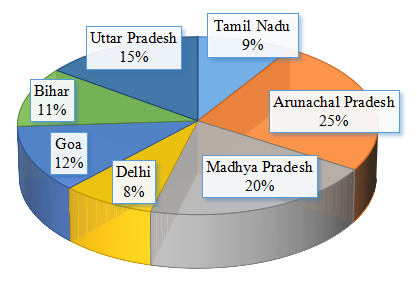
Total population of the given states = 32760000
|
States |
Sex and literacy wise Population Ratio |
|||
|
Sex |
Literacy |
|||
|
M |
F |
Literate |
Illiterate |
|
|
Arunachal Pradesh |
5 |
3 |
2 |
7 |
|
Madhya Pradesh |
3 |
1 |
1 |
4 |
|
Delhi |
2 |
3 |
2 |
1 |
|
Goa |
3 |
5 |
3 |
2 |
|
Bihar |
3 |
4 |
4 |
1 |
|
Uttar Pradesh |
3 |
2 |
7 |
2 |
|
Telangana |
3 |
4 |
9 |
4 |
What was the number of males in Bihar in the year 1998 ?
Answer & explanation
Correct answer: option 4
Total population of bihar state = 11% of 32760000 = 3603600
Ratio of male to female in bihar = 3 : 4
Number of males in Bihar = \(\frac{3}{7}\) × 3603600 = 1544400