CUET Preparation Today
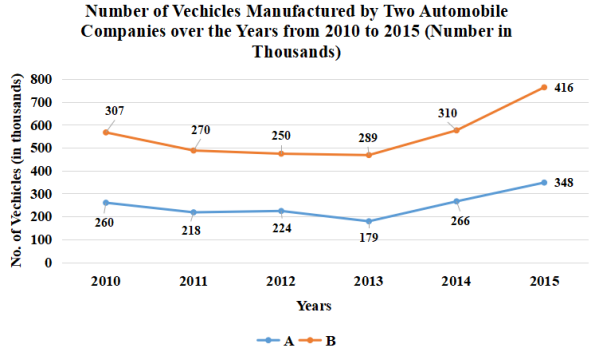
Study the line graph and answer the question that follows. \The line graph represents the number of vehicles (in thousands) manufactured by two automobile companies A and B over the years from 2010 to 2015. The X-axis represents the years and the Y-axis represents number of vehicles in thousands. (The data shown here is only for mathematical exercise. They do not represent the actual figures of the country.)
Company B is projecting an increase in the number of vehicles to be manufactured in 2016 by 70% with respect to its average number of vehicles from 2010 to 2015. What should be the approximate percentage increase in the number of vehicles (in thousands) to be manufactured by Company A in 2016 with respect to the number of vehicles in 2015, so that it is at par with Company B? |
57 42 50 45 |
50 |
Average number of vehicles manufactured by company B from 2010 to 2015 = \(\frac{307+270+250+289+310+416 }{6}\) = \(\frac{ 1842}{6}\) = 307 Number of vehicles manufactured by B in 2016 = \(\frac{100+70 }{100}\) × 307 = \(\frac{170 }{100}\) × 307 = 521.9 Number of vehicles manufactured by A in 2015 = 348 ATQ, Number of vehicles manufactured by A in 2016 is 521.9 SO percentage increase in manufacture in vehicles by A in 2016 as comoared to 2015 = \(\frac{521.9 - 348 }{348}\) × 100 = \(\frac{ 173.9 }{348}\) × 100 = 49.97% = 50% ( approx ) |