CUET Preparation Today
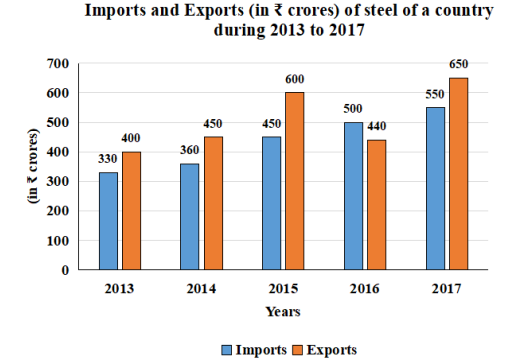
Study the bar graph which shows the imports and exports (in ₹) of steel of a country during 2013 to 2017 and answer the question that follows.
For how many year(s) were the imports less than 80%ofthe average exports (per year) of the country during the five years? |
4 1 3 2 |
2 |
80% of average imports of country in all 5 years = \(\frac{80 }{100}\) × \(\frac{400+450+600+440+650 }{5}\) = \(\frac{4 }{5}\) × \(\frac{ 2540 }{5}\) = 406.4 Imports in year 2013 & 2014 is less than 80% of average imports of country in all 5 years . Ans :- 2
|