CUET Preparation Today
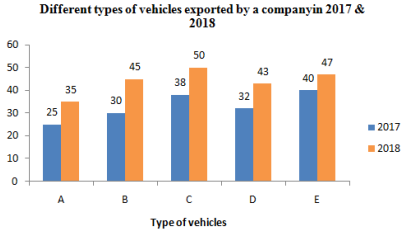
The given Bar Graph presents the number of different types of vehicles exported by a company in 2017 and 2018.
What is the ratio of the total number of vehicles exported in 2017 of types B, C and D to that of vehicles exported in 2018 of the types A, D and E? |
6 : 5 7 : 10 4 : 5 18 : 25 |
4 : 5 |
total number of vehicles exported in 2017 of types B, C and D : total number of vehicles exported in 2018 of the types A, D and E ( 30 + 38 + 32 ) : ( 35 + 43 + 47 ) 100 : 125 4 : 5 |