CUET Preparation Today
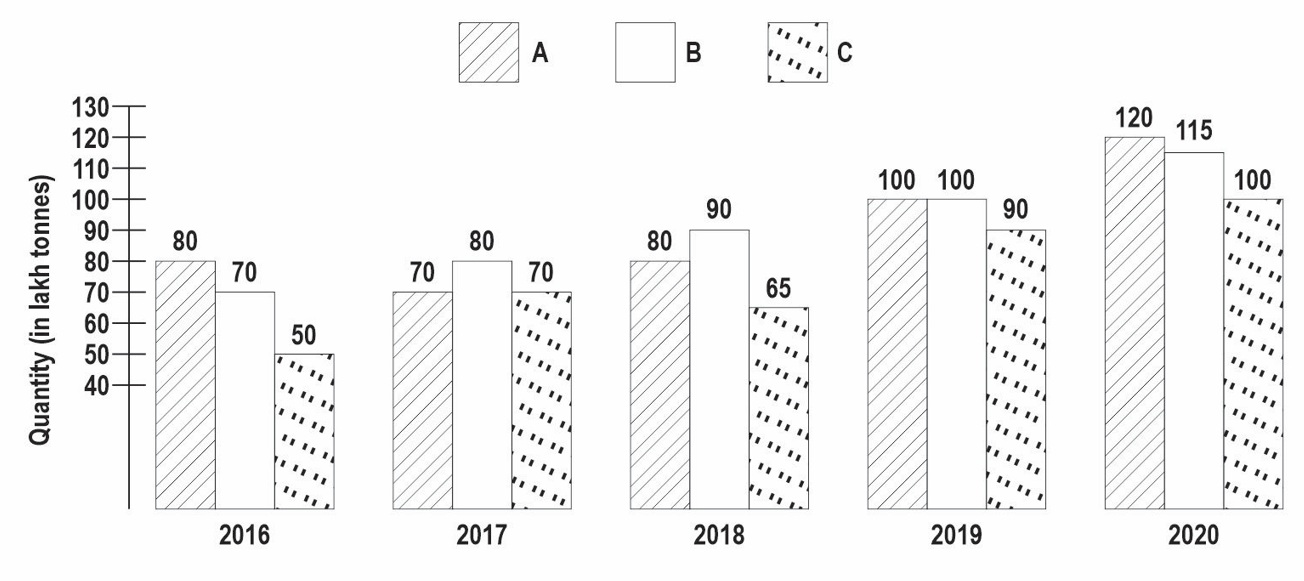
The given bar graph indicates production of salt (in lakh tons) by 3 different companies P, Q and R from year 2016 to 2020. Production of salt by company A, B and C from 2016 to 2020.
In 2021, percentage increase in production of company C will be same as percentage increase in production of company C in 2020 as compared to 2019. Find production of company C in year 2021 (in lakh tons)? |
101.11 111.11 121.11 135 |
111.11 |
Production of C in 2019 = 90 lakh Production of C in 2020 = 100 lakh Percentage increase = \(\frac{10}{90}\) × 100% = 11.11% Therefore, production of company C in year 2021 will be = 100 × 111.11% = 111.11 |