CUET Preparation Today
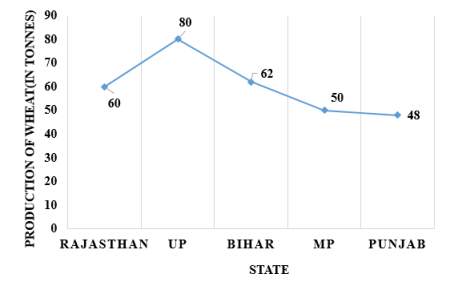
The following line graph shows the production of wheat in five different states in the year 2020. What is the average production of wheat in these five states in the year 2020?
|
60 tonnes 70 tonnes 57 tonnes 50 tonnes |
60 tonnes |
Average production of wheat in all five years = \(\frac{60 + 80 + 62 + 50 + 48}{5}\) = \(\frac{300}{5}\) = 60 tonnes |