CUET Preparation Today
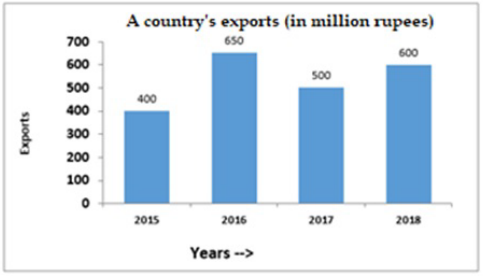
The given Bar Graph presents a country's exports (in million rupees) during 2015-2018, and the Table that follows shows the break-up of goods exported in a year.
Break-Up of Goods Exported in a Year
Total exports of cosmetics in four years is approximately what percent less than the total exports of Garments and Jewellery in 2015 and 2018? |
12.2 10.4 9.8 11.6 |
10.4 |
Total export of cosmetics in all 4 years = \(\frac{15 }{100}\) × 400 + \(\frac{15}{100}\) × 650 + \(\frac{15}{100}\) × 500 + \(\frac{15 }{100}\) × 600 = 60 + 97.5 + 75 + 90 = 322.5 total exports of Garments and Jewellery in 2015 and 2018 = \(\frac{28 }{100}\) × 400 + \(\frac{28 }{100}\) × 600 + \(\frac{8 }{100}\) × 400 + \(\frac{8 }{100}\) × 600 = 112 + 168 + 32 + 48 = 360 Required percentage = \(\frac{360 - 322.5 }{360}\) × 400 = \(\frac{37.5 }{360}\) × 400 = 10.4% |