
Which type of human population is represented by the following age pyramid?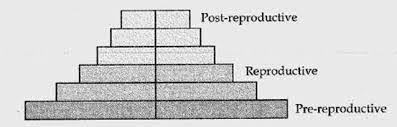
Answer & explanation
Correct answer: option 3
The correct answer is Option (3) → Expanding population.
An age pyramid shows the per cent of individuals in each age group: pre-reproductive at the bottom, reproductive in the middle and post-reproductive at the top. Its shape tells whether the population is growing, stable or declining. The pyramid in the question has a very broad base and narrows steadily towards the top, so the young, pre-reproductive group is the largest.
Option (1) Stable population. — Incorrect. A stable population has a pre-reproductive group about as large as the reproductive group above it, so its sides rise almost straight before narrowing. The pyramid shown has a much wider base than that.
Option (2) Declining population. — Incorrect. A declining population has a narrow base: fewer young individuals than adults of reproductive age. The pyramid shown is the opposite.
Option (3) Expanding population. — Correct. A broad base means many young individuals who will soon enter the reproductive age, so the population will keep growing. This is the expanding pyramid of Figure 11.1.
Option (4) Vanishing population. — Incorrect. The book describes only three types of age pyramid: expanding, stable and declining. “Vanishing population” is not one of them.
Note: The three little pyramids of Figure 11.1 carry their names only as labels under them, not in any paragraph. They may look like a child’s building blocks, but they earn marks like any page of text.
NCERT Extract:
Population Attributes – “… A population at any given time is composed of individuals of different ages. If the age distribution (per cent individuals of a given age or age group) is plotted for the population, the resulting structure is called an age pyramid (Figure 11.1). For human population, the age pyramids generally show age distribution of males and females in a diagram. The shape of the pyramids reflects the growth status of the population - (a) whether it is growing, (b) stable or (c) declining.”
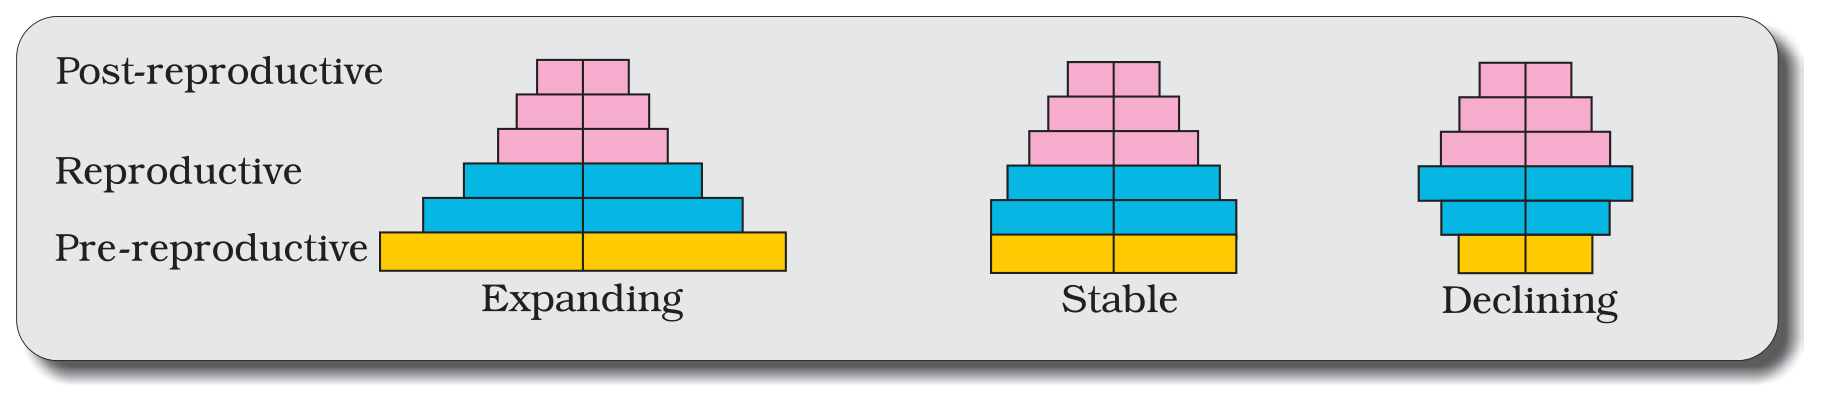
Figure 11.1 Representation of age pyramids for human population