
Study the given graph and answer the question that follows. The graph shows the number of appeared candidates and passed candidates (in hundreds) in a test from six different institutions.
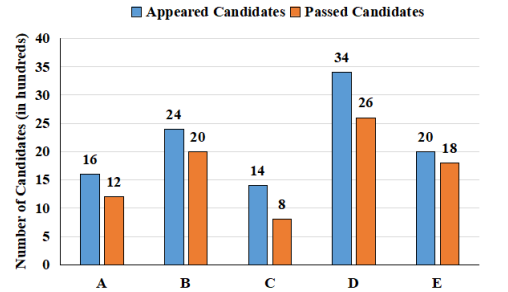
Also, the question should be "What is the average number (in hundreds) of candidates to have passed per institution?
Answer & explanation
Correct answer: option 4
Average number of candidates passed per institution = \(\frac{12+20+8+26+18 }{5}\)
= \(\frac{ 84 }{5}\)
= 16.8 ( in hundreds )
= 1680