


CUET Preparation Today
The given histogram represents the marks of students in Mathematics test of a certain class. The total number of students is 350. Study the graph and answer the question that follows.
|
110 : 137 9 : 11 11 : 9 137 : 110 |
110 : 137 |
Number of students who scored 140 marks and above : Number of students who scored marks between 60 to 120 (55 + 40 + 15) : ( 32 + 45 + 60) 110 : 137 |

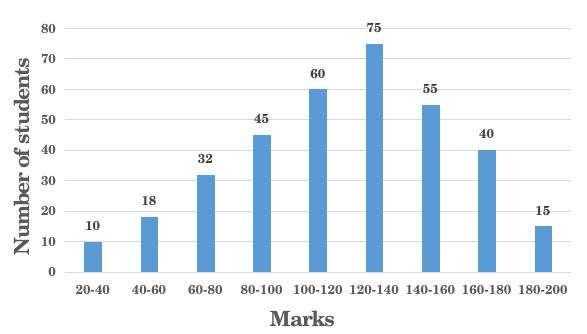 What is the ratio of the total number of students who scored 140 marks and above to the total number of students who scored marks between 60 to 120 ?