CUET Preparation Today
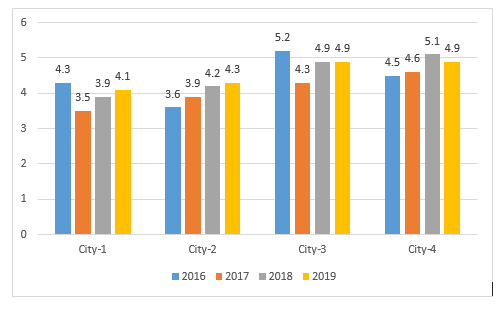
The following graph shows the sales of cars (in thousands) in four cities in 4 years. Study the graph and answer the question.
In which year, the sales are higher? |
2018 2016 2019 2017 |
2019 |
Sale in year 2016 = 4.3 + 3.6 + 5.2 + 4.5 = 17.6 Sale in year 2017 = 3.5 + 3.9 + 4.3 + 4.6 = 16.3 Sale in year 2018 = 3.9 + 4.2 + 4.9 + 5.1 = 18.1 Sale in year 2019 = 4.1 + 4.3 + 4.9 + 4.9 = 18.2 Sale in year 2019 is highest. |