CUET Preparation Today
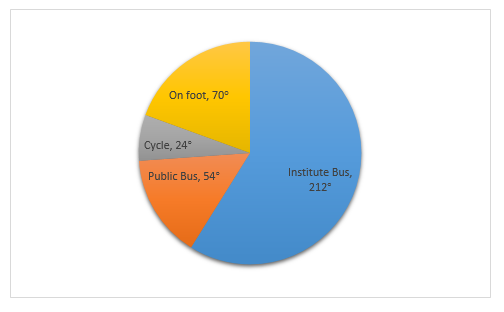
Study the pie-chart and answer the question. In an institute, there are 900 students who use different modes of transport for to and from travel. The given pie diagram represents the requisite data.
The number of students who do NOT use the institute bus is: |
420 370 360 350 |
370 |
Number of students who do NOT use the institute bus = \(\frac{54+24+70 }{360 }\) × 900 = \(\frac{ 148 }{360 }\) × 900 = 370 |