CUET Preparation Today
The final scores of 1 lakh aspirants of an entrance exam are collected randomly. Which of the following is the most likely graph of distribution of scores ? |
|
|
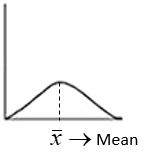
The correct answer is Option (4)
The most likely graph of the distribution of scores will be a bell shaped and symmetric, with the highest frequency of scores around the mean. |