CUET Preparation Today
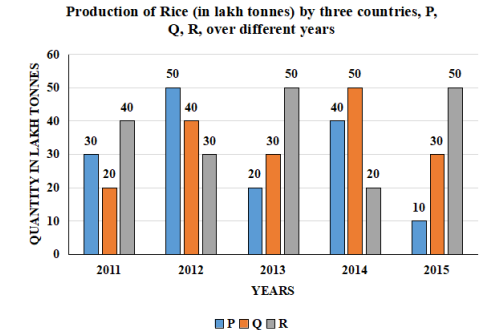
Study the given graph and answer the question that follows.
For which of the following years was the percentage rise/fall in production from the previous year maximum for country R? |
2013 2011 2012 2015 |
2015 |
⇒ Percentage fall in production of R in 2012 = \(\frac{10 }{40}\) × 100 = 25% ⇒ Percentage rise in production of R in 2013 = \(\frac{20 }{30}\) × 100 = 66.67% ⇒ Percentage fall in production of R in 2014 = \(\frac{30 }{50}\) × 100 = 60% ⇒ Percentage fall in production of R in 2015 = \(\frac{30 }{20}\) × 100 = 150% ⇒ So , Percentage fall in production of R is maximum for year 2015 i.e. 150% |