CUET Preparation Today
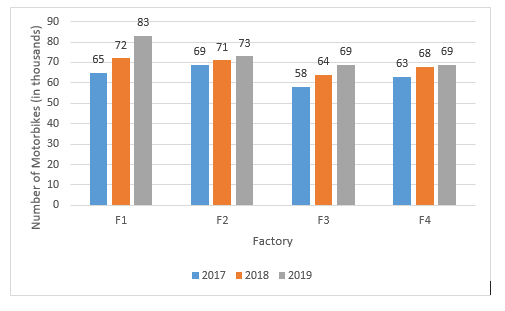
The following bar graph shows the sales ( in thousands) of motor bikes by the factories, F1, F2, F3 and F4 in 2017, 2018 and 2019.
Which of the factories witnessed the highest increase in the percentage of sales from 2018 to 21019? |
F3 F2 F1 F4 |
F1 |
For factory F1 , Sale in 2018 = 72 Sale in 2019 = 83 Percentage increase in sale from 2018 to 2019 = \(\frac{83-72 }{72 }\) × 100 = \(\frac{11}{72 }\) × 100 = 15.28% For factory F2 , Sale in 2018 = 71 Sale in 2019 = 73 Percentage increase in sale from 2018 to 2019 = \(\frac{73-71 }{71 }\) × 100 = \(\frac{2}{71 }\) × 100 = 2.82% For factory F3 , Sale in 2018 = 64 Sale in 2019 = 69 Percentage increase in sale from 2018 to 2019 = \(\frac{69-64 }{64 }\) × 100 = \(\frac{5}{64 }\) × 100 = 7.81% For factory F4 , Sale in 2018 = 68 Sale in 2019 = 69 Percentage increase in sale from 2018 to 2019 = \(\frac{69-68 }{68 }\) × 100 = \(\frac{1}{68 }\) × 100 = 1.47% So , highest increase in the percentage of sales from 2018 to 21019 is of factory F1. |