CUET Preparation Today
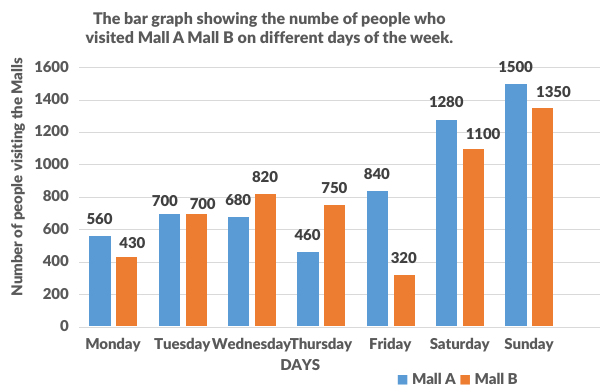
The bar graph shows the number of people who visited Mall A and Mall B on different days of a week.
What is the ratio of the number of people visiting Mall A on Thursday, Saturday and Sunday together to the number of people visiting Mall B on these three days together? |
27 : 25 80 : 81 81 : 80 25 : 27 |
81 : 80 |
Person visiting Mall A on Thursday, Saturday and Sunday : Person visiting Mall B on Thursday, Saturday and Sunday (460 + 1280 + 1500) : ( 750 + 1100 + 1350 ) 3240 : 3200 81 : 80 |