CUET Preparation Today
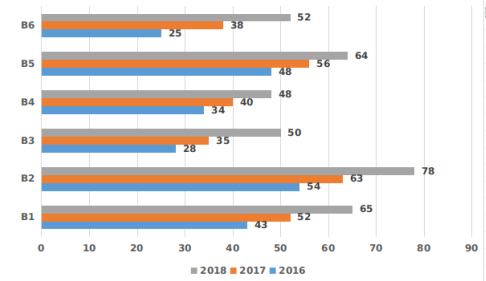
The following graph shows the data of the collection of interest on loans (in crore €) by six branches B1, B2, B3, B4, BS and B6 of a bank during the years mentioned.
Based on the information, from the year 2016 to 2017, the highest rate of collection is for the branch: |
B4 B1 B3 B6 |
B6 |
Lets solve one by one for each option. 1. B4 Increase in rate of collection = \(\frac{40-34 }{34}\) × 100 = \(\frac{6}{34}\) × 100 = 17.6% 2. B1 Increase in rate of collection = \(\frac{52-43 }{43}\) × 100 = \(\frac{9}{43}\) × 100 = 20.9% 3. B3 Increase in rate of collection = \(\frac{35-28 }{28}\) × 100 = \(\frac{7}{28}\) × 100 = 25% 4. B6 Increase in rate of collection = \(\frac{38-25 }{25}\) × 100 = \(\frac{13}{25}\) × 100 = 52% So , the highest rate of collection is for the branch B6 Ans :- B6 |