CUET Preparation Today
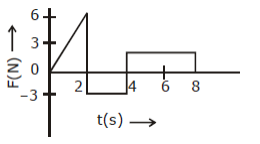
The force ‘F acting on a particle of mass ‘m’ is indicated by the force – time graph shown below. The change in momentum of the particle over the time Interval from zero to 8 s Is :
|
24 N s 20 N s 12 N s 5 N s |
12 N s |
Change in momentum, \(\Delta p = \text{Area of F-t graph} \) =\(\frac{1}{2}\)×2×6 -3×2 + 4×3 = 12Ns |