CUET Preparation Today
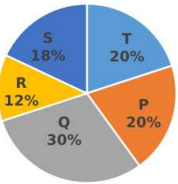
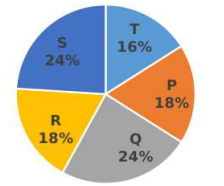
The given pie charts represent the distribution of candidates who enrolled for a bank clerical examination and the candidates (out of those enrolled) who passed the examination, from five different institutes P,Q. R. S and T. Study the pie charts and answer the question that follows. (i) Total number of candidates who enrolled for the examination from five institutes = 5500 Fig. (i) (ii) Total number of candidates who passed the examination from five institutes = 3300 Fig. (ii) Which institute(s) has/have the highest percentage of candidates passed to the candidates enrolled? |
P S Q and T R |
R |
In P, Candidates enrolled in P = \(\frac{20 }{100}\) × 5500 = 1100 Candidates passed in P = \(\frac{18 }{100}\) × 3300 = 594 Required percentage = \(\frac{594}{1100}\) × 100 = 54% In Q, Candidates enrolled in Q = \(\frac{30 }{100}\) × 5500 = 1815 Candidates passed in Q = \(\frac{24 }{100}\) × 3300 = 792 Required percentage = \(\frac{792}{1815}\) × 100 = 43.63% In R, Candidates enrolled in R = \(\frac{12 }{100}\) × 5500 = 660 Candidates passed in R = \(\frac{18 }{100}\) × 3300 = 594 Required percentage = \(\frac{594}{660}\) × 100 = 90% In S, Candidates enrolled in S = \(\frac{18 }{100}\) × 5500 = 990 Candidates passed in S = \(\frac{24 }{100}\) × 3300 = 792 Required percentage = \(\frac{792}{990}\) × 100 = 80% In T, Candidates enrolled in T = \(\frac{20 }{100}\) × 5500 = 1100 Candidates passed in T = \(\frac{16 }{100}\) × 3300 = 528 Required percentage = \(\frac{528}{1100}\) × 100 = 48% So , Institute R has the highest percentage of candidates passed to the candidates enrolled. Ans :- R |