CUET Preparation Today
Study the given graph and answer the question that follows.
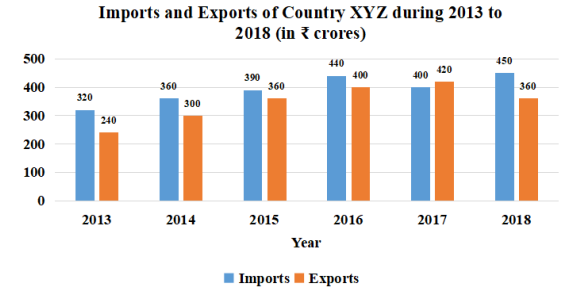
What percentage of the imports in 2018 is the average exports in 2013, 2015 and 2017? (correct to one decimal place) |
77.8 72.4 71.6 75.6 |
75.6 |
Average exports in 2013, 2015 and 2017 = \(\frac{240 + 360 + 420 }{3}\) = \(\frac{ 1020}{3}\) = 340 Imports in 2018 = 450 Percentage of Import in 2018 compared to Average exports in 2013, 2015 and 2017 = \(\frac{340 }{450}\) × 100 = 75.6%
|