CUET Preparation Today
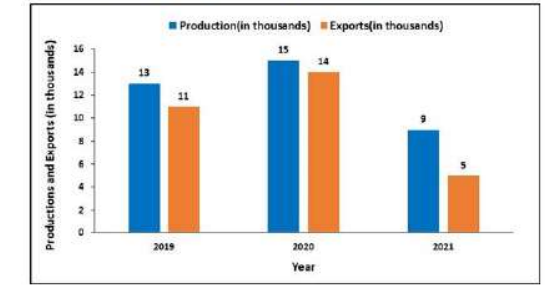
The bar graph shows the total production and export of computers (in thousands) by a company in three years. Find the average export by the company in the given years.
|
12,000 15,000 16,000 10,000 |
10,000 |
The average export by the company = $\frac{Sum\;of\;exports\;for\;3\;years}{3}$ = $\frac{11000+14000+5000}{3}$ = $\frac{30000}{3}$ = 10,0000 |