CUET Preparation Today
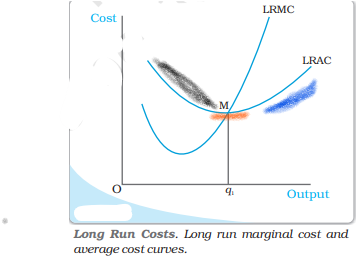
Study the given figure. The portion of LRAC curve highlighted by blue colour in the graph explains which concept?
|
Increasing Returns to Scale Decreasing returns to Scale Economies of Scale Cobb Douglas Production Function |
Decreasing returns to Scale |
The correct answer is Option 2: Decreasing returns to Scale DRS implies that if we want to increase the output by a certain proportion, inputs need to be increased by more than that proportion. As a result, cost also increases by more than that proportion. So, as long as DRS operates, the average cost must be rising as the firm increases output. It is argued that in a typical firm IRS is observed at the initial level of production. This is then followed by the CRS and then by the DRS. Accordingly, the LRAC curve is a ‘U’-shaped curve. Its downward sloping part corresponds to IRS and upward rising part corresponds to DRS. At the minimum point of the LRAC curve, CRS is observed. |