CUET Preparation Today
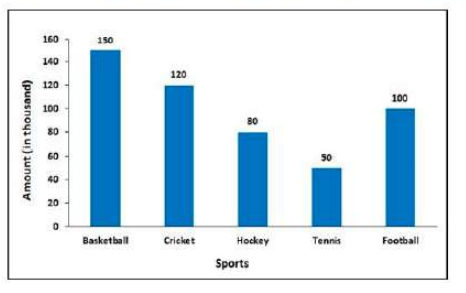
The following bar graph shows the amount of money spent on various sports by a school administration in a particular year. The amount spent on Hockey and Football is what percent of the amount spent on Basketball and Tennis? |
20% 70% 90% 50% |
90% |
The amount spent on Hockey and Football = 80 + 100 = 180 The amount spent on Basketball and Tennis = 150 + 50 = 200 Thus, 180 of 200 = $\frac{180}{200}$ x 100 = 90% The amount spent on Hockey and Football is 90% of The amount spent on Basketball and Tennis. |