CUET Preparation Today
Study the given graph and answer the question that follows.
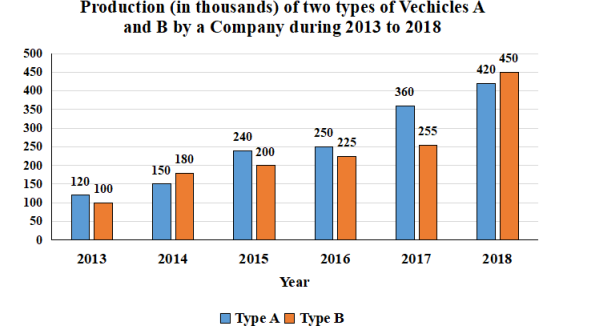
$31\frac{1}{4}$ % of the total number of vehicles of type A produced in 2013, 2015 and 2017 is equal to the number of vehicles of type B produced in the year: |
2017 2018 2015 2016 |
2016 |
31\(\frac{1 }{4}\) % of the total number of vehicles of type A produced in 2013, 2015 and 2017 = 31\(\frac{1 }{4}\) × ( 120 + 240 + 360 ) = \(\frac{125 }{400}\) × ( 120 + 240 + 360 ) = \(\frac{125 }{400}\) × (720 ) = 225 By carefully observing the graph. We find that Production of company B in 2016 is 225 which is equal to 31\(\frac{1 }{4}\) % of the total number of vehicles of type A produced in 2013, 2015 and 2017. Ans :- 2016 |