
Which of the following graphs are correct for the first order reaction?
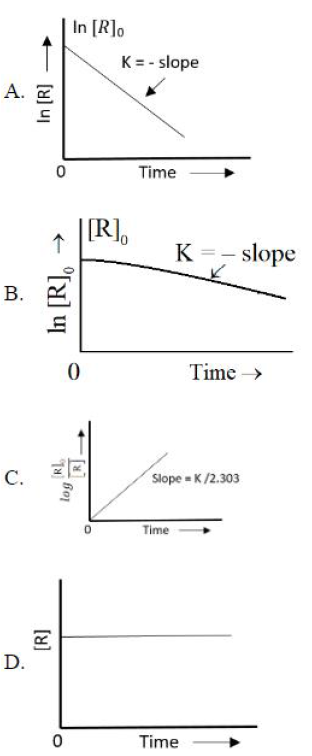
Choose the correct answer from the options given below.
Answer & explanation
Correct answer: option 3
The correct answer is Option (3) → A and C only
The integrated rate equation of a first order reaction can be written in two straight-line forms:
\( \displaystyle \ln[R] = \ln[R]_0 - kt \)
\( \displaystyle \log\frac{[R]_0}{[R]} = \frac{k}{2.303}\,t \)
A. ln[R] against time, a falling straight line with slope −k — Correct.
B. ln[R] against time drawn as a curve — Incorrect. For a first order reaction this plot is a straight line.
C. log([R]0/[R]) against time, a straight line through the origin with slope k/2.303 — Correct.
D. [R] constant with time — Incorrect. The concentration of a reactant always falls as the reaction proceeds.