CUET Preparation Today
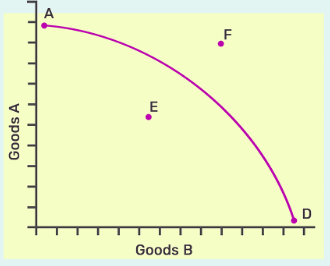
Consider an economy with fixed amount of resources and given technological state. It produces only 2 goods – Good A and Good B. Different combinations showing maximum outputs of two goods which can be produced (when given resources and technology are used fully) are plotted on a graph. When all the plotted points are joined, following graph was obtained.
Based on the above graph, answer the following questions. |
Which point on the graph shows underutilization of resources? |
Point A Point E Point F Point D |
Point E |
The correct answer is Option 2: Point E Any point on the Production Possibility Frontier indicates optimum utilization of resources whereas any point below it represents underutilization. |