CUET Preparation Today
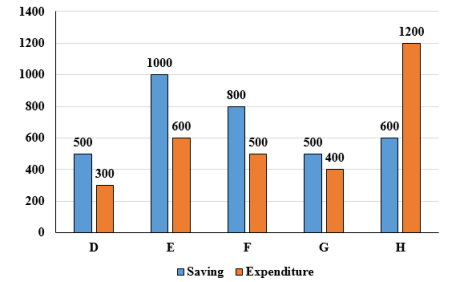
The bar graph given below shows the saving and expenditure of 5 companies D, E, F, G and H.
The total income of all the companies is what percent of the total expenditures? |
213.33 percent 166.73 percent 233.33 percent 199.66 percent |
213.33 percent |
Total income = Total expenditure + Total saving = ( 300+600+500+400+1200) + (500+1000+800+500+600 ) = 3000 + 3400 = 6400 Total expenditure = 300+600+500+400+1200 = 3000 Required percentage = \(\frac{6400}{3000}\) × 100 = 213.33% |