CUET Preparation Today
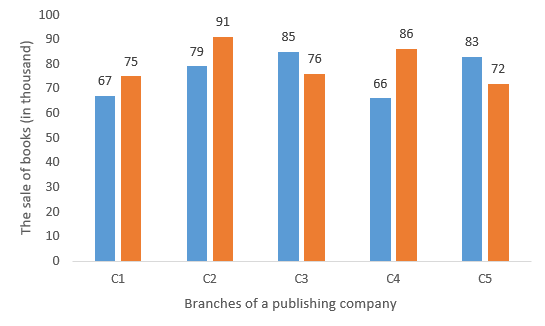
The bar graph below shows the sale of books (in thousands) has been given in two consecutive years of 2010 and 2011 of five branches of a publishing company. Find the ratio of total sales in the two years of branch C2 to the sales in both years of branch C4 ?
|
169 : 153 85 : 76 153 : 169 76 : 85 |
85 : 76 |
Total sale of C2 : Total sale of C4 ( 79 + 91 ) : ( 66 + 86 ) 170 : 152 85 : 76 |