CUET Preparation Today
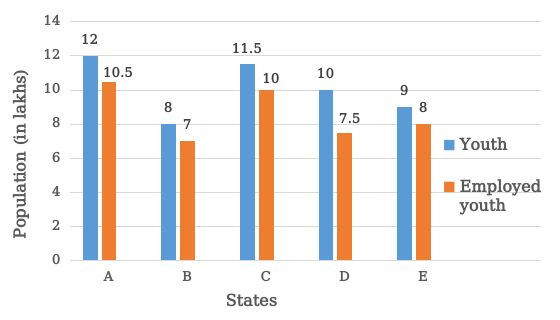
The following bar graph shows the number of youth (in lakhs) and the number of employed youth (in lakhs) in five states A, B, C, D and E. Which state(s) has employed youth less than 80% of its total youth population?
|
D B and D C and D A |
D |
Percentage of employed youth of A = \(\frac{10.5}{12}\) × 100 = 87.5% Percentage of employed youth of B = \(\frac{7}{8}\) × 100 = 87.5% Percentage of employed youth of C = \(\frac{10}{11}\) × 100 = 90.90% Percentage of employed youth of D = \(\frac{7.5}{10}\) × 100 = 75% Percentage of employed youth of E = \(\frac{8}{9}\) × 100 = 88.89% So , D has employed youth less than 80% of its total youth population |