CUET Preparation Today
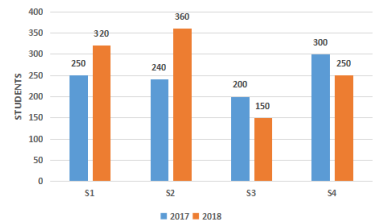
The given bar graph represents the number of students admitted in four schools (S1, S2, S3, S4) during two consecutive years 2017 and 2018.
The total number of students admitted in school S3 for both years is approximately what percent of total student admitted in school S2 for both years? |
52.33% 48.33% 54.33% 58.33% |
58.33% |
Total number of students admitted in school S3 for both years = 200 + 150 = 350 Total student admitted in school S2 for both years = 240 + 360 = 600 Required percentage = \(\frac{350 }{600}\) × 100 = 58.33% |