CUET Preparation Today
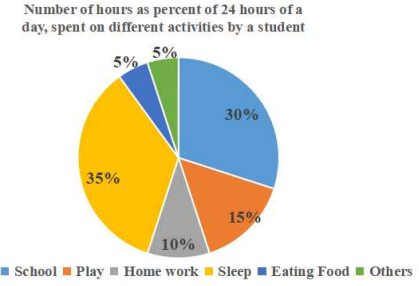
The pie-chart below represents the number of hours as percent of 24 hours of a day, spent on different activities by a student, Study the pie chart and answer the question that follows.
If the pie-chart is a visual representation of the number of hours spent on different activities by a student during a day, then the student spends the maximum number of hours in a day: |
doing homework playing sleeping at school |
sleeping |
By carefully observing the Pie-chart , Student spent maximum number of hours in a day in sleeping i.e. 35% of a day. Ans:- Sleeping |