CUET Preparation Today
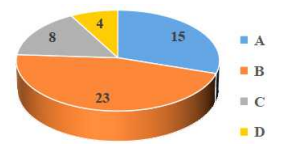
Study the given pie-chart and answer the question that follows. The pie-chart below represents the actual number of students securing different grades in a science test.
Calculate the percentage of students who took the test and secured a D grade. |
2 16 4 8 |
8 |
Total number of students = 4 + 15 + 23 + 8 = 50 Number of students secured D grade = 4 Percentage of students secured D grade = \(\frac{4}{50}\) × 100 = 8% |