CUET Preparation Today
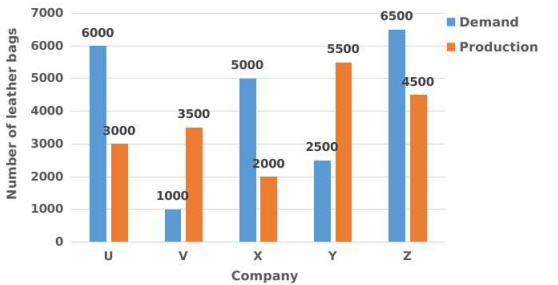
Study the given graph and answer the question that follows. The chart represents the demand and production of leather bags by five companies U, V, X, Y and Z.
If h% of the demand of leather bags for company X equals the demand of the leather bags for company V, then h equals: |
22 20 18 24 |
20 |
Demand of leather bag of X = 5000 Demand of leather bag of V = 1000 ATQ , h% of 5000 = 1000 \(\frac{h }{100}\) × 5000 = 1000 h = 20% |