CUET Preparation Today
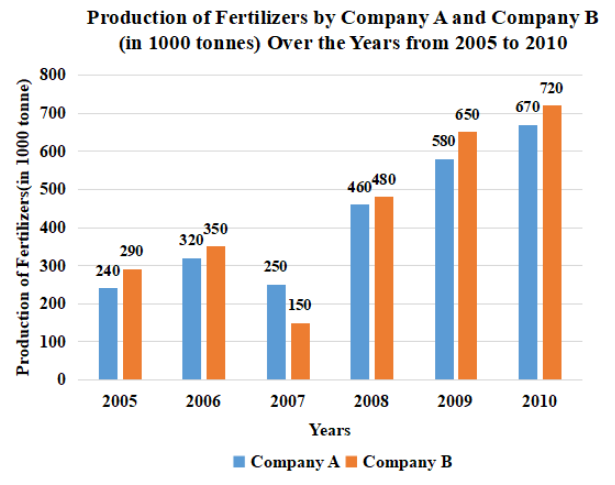
The following Bar Graph represents the Production of Fertilizers by Company A and Company B (in 10000 tonnes) Over the Years from 2005 to 2010. The X-axis represents the years, and the Y-axis represents the Production of Fertilizers (in 10000 tonnes). (Note: The data shown below is only for mathematical exercise. They do not represent the actual figures of the companies)
What is the average production (in 10000 tonnes) of fertilizers in 2008,2009 and 2010 of Company A? |
600 570 590 620 |
570 |
Average production of fertilizer A in 2008 , 2009 , 2010 = \(\frac{460 + 580 +670}{3}\) = \(\frac{ 1710}{3}\) = 570 |