CUET Preparation Today
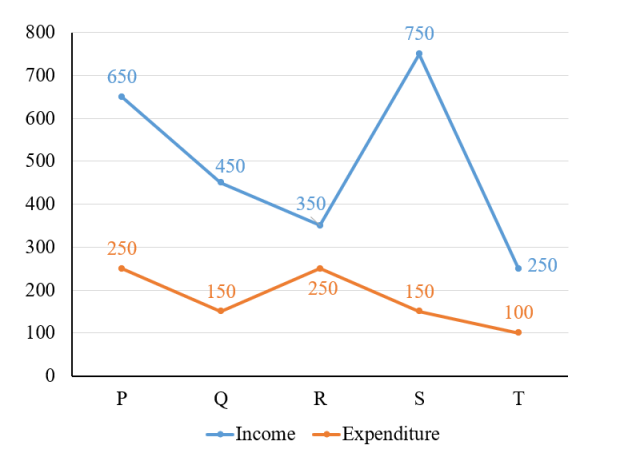
The line chart given below shows the income and expenditure of a company in five yearn.
The income in year P and Q together is how much percent more than the expenditure in year S and T together? |
380 percent 220 percent 29 percent 340 percent |
340 percent |
Income of P & Q = 650 + 450 = 1100 Expenditure of S & T = 150 + 100 = 250 Required percentage = \(\frac{1100 - 250 }{250}\) × 100 = \(\frac{850}{250}\) × 100 = 340% |