CUET Preparation Today
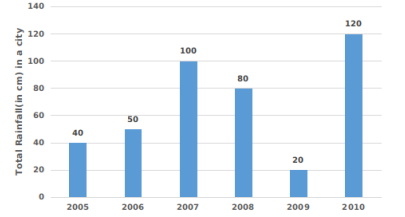
The given graph represents the rainfall (in cm) in a city, over a period of six years. Study the graph and answer the question that follows.
In which two consecutive years was the difference of the rainfall minimum? |
2007 - 2008 2006 - 2007 2008 - 2009 2005 - 2006 |
2005 - 2006 |
Difference in rainfall in 2005 and 2006 = 50 - 40 = 10 Difference in rainfall in 2006 and 2007 = 100 - 50 = 50 Difference in rainfall in 2007 - 2008 = 100 - 80 = 20 Difference in rainfall in 2008 - 2009 = 80 - 20 = 60 Difference in rainfall in 2009 - 2010 = 120 - 20 = 100 Difference in rainfall minimum = 10 cm For two consecutive years is for 2005 - 2006 |