CUET Preparation Today
Study the given graph and answer the following question
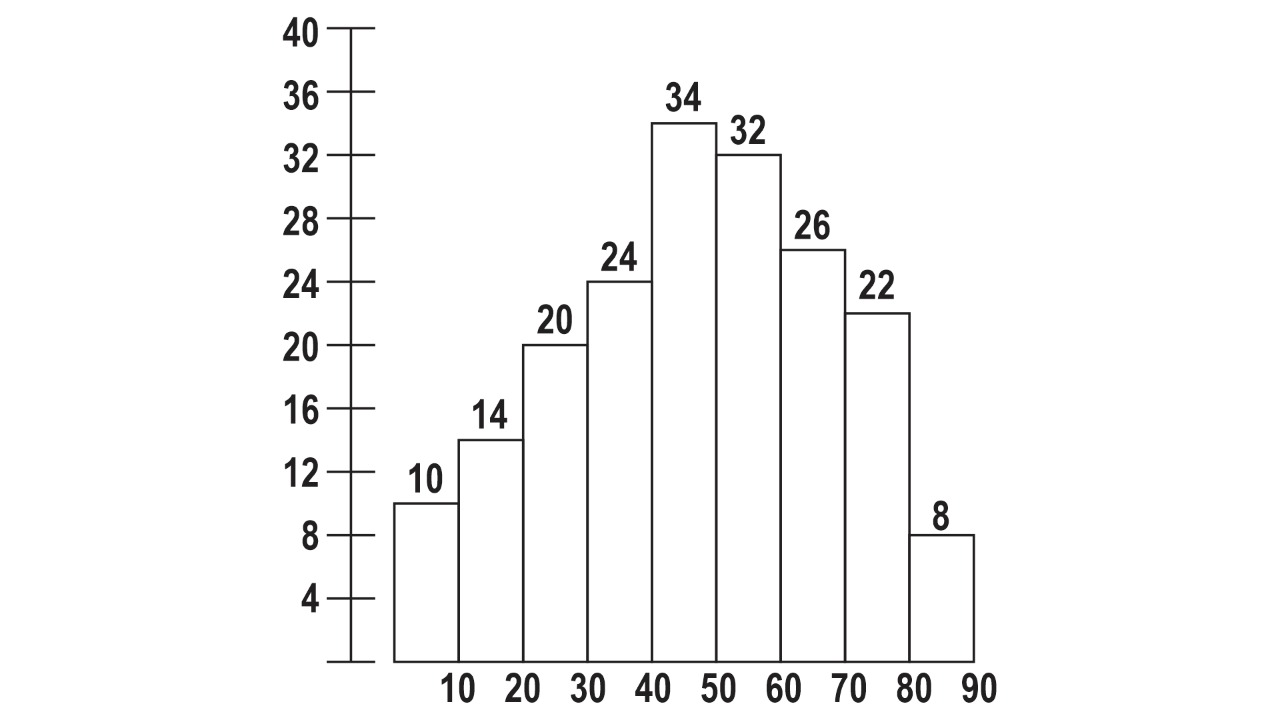
The number of patients aged 10 or more years but below 40 years is what percent less than the no. of patient aged 40 or more years but below 70 years? |
35.4% 36.95% 40.1% 43.4% |
36.95% |
No. of patients aged 10 or more years but below 40 ⇒ 14 + 20 + 24 = 58 No. of patients aged 40 or more but less than 70 years ⇒ 34 + 32 + 26 = 92 ⇒ 92 - 58 = 34 ⇒ \(\frac{34}{92}\) × 100% = 36.95% |