CUET Preparation Today
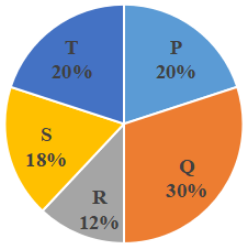
The following Pie charts represent the distribution of candidates who were enrolled for competitive examination and the candidates (out of those enrolled) who passed the exam from five different institutes P, Q, R, S and T. Fig.(i) Total number of candidates enrolled in five different institutes = 7500
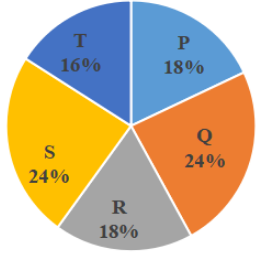
Fig.(ii) Total number of candidates passed the examination from five Institutes = 4000
What is the pass percentage for institute Q? (correct up to one decimal place.) |
71.1% 42.7% 48% 80% |
42.7% |
Total candidates enrolled in Q = \(\frac{3}{10}\) × 7500 = 2250 Passed students of Q = \(\frac{24}{100}\) × 4000 = \(\frac{6}{25}\) × 4000 = 960 Percentage of passed students in Q = \(\frac{960}{2250}\) × 100 = 42.67% = 42.7% (correct up to one decimal place.)
|