CUET Preparation Today
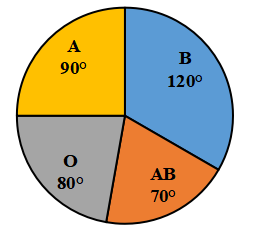
The following pie-chart shows the data regarding the donors of A, B, O and AB blood groups.
The ratio of the number of donors of blood group 'O' to the average of the number of donors of blood groups 'A' and 'AB' together is: |
2 : 3 1 : 1 2 : 1 1 : 2 |
1 : 1 |
Donors of blood group O : Average of donors of blood group A and AB 80º : \(\frac{90º + 70º}{2}\) 80º : 80º 1 : 1 |