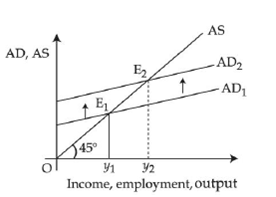
Assume a two-sector economy in the above diagram, the initial demand curve AD1 shifts upward to AD2 due to:
Answer & explanation
Correct answer: option 4
The correct answer is Option (4) → Increase in autonomous investment
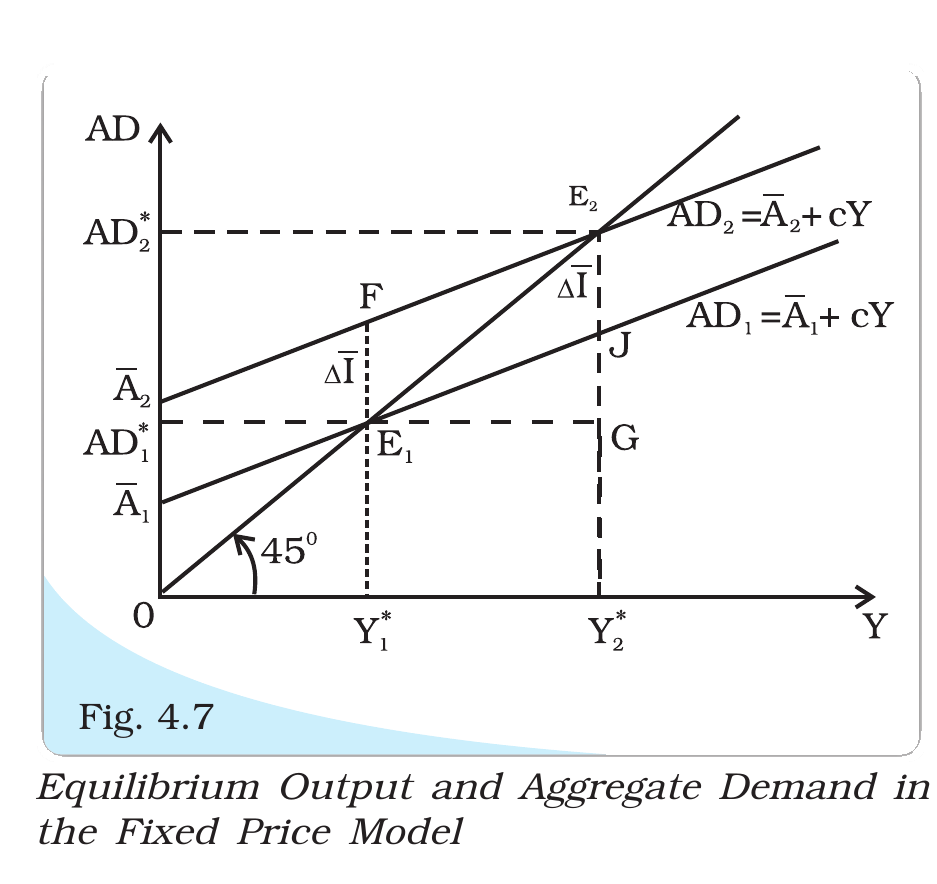
In the diagram, AD2 lies parallel to AD1. So aggregate demand (AD) is higher by the same amount at every income, and the slope is unchanged. In a two-sector economy, AD is consumption (C) plus investment (I). So a rise in autonomous investment, which does not depend on income, gives this shift.
Option (1) Increase in average propensity to save — Incorrect. If people save a larger share of income, they consume less. That would pull AD down.
Option (2) Increase in aggregate supply — Incorrect. The diagram shows supply as the separate line AS. A change in supply does not move the AD line.
Option (3) Increase in the marginal propensity to consume — Incorrect. The marginal propensity to consume (MPC) is the slope of the AD line. A higher MPC makes the line steeper, so the two lines would not be parallel.
Option (4) Increase in autonomous investment — Correct. Investment here is the same at every income. A rise in it shifts the AD line upwards in parallel.
NCERT (2026-27): “4.3.2 Effect of an Autonomous Change in Aggregate Demand on Income and Output We have seen that the equilibrium level of income depends on aggregate demand. Thus, if aggregate demand changes, the equilibrium level of income changes. … Now, let investment rise to 20. It can be seen that the new equilibrium will be 300. This can be seen by looking at the graph. This increase in income is due to rise in investment, which is a component of autonomous expenditure here. When autonomous investment increases, the AD1 line shifts in parallel upwards and assumes the position AD2.… …When c changes, however, the line swings up or down.…”
|