CUET Preparation Today
The following figure is an example of ____________.
|
Simple Bar diagram Histogram Component Bar Diagram Multiple Bar diagram |
Component Bar Diagram |
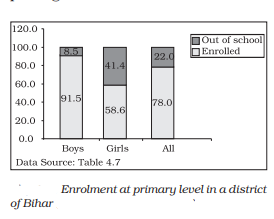
The correct answer is Option 3: Component Bar Diagram Component Bar Diagram: Component bar diagrams or charts , also called sub-diagrams, are very useful in comparing the sizes of different component parts (the elements or parts which a thing is made up of) and also for throwing light on the relationship among these integral parts. For example, sales proceeds from different products, expenditure pattern in a typical Indian family (components being food, rent, medicine, education, power, etc.), budget outlay for receipts and expenditures, components of labour force, population etc. Component bar diagrams are usually shaded or coloured suitably. A component bar diagram shows the bar and its sub-divisions into two or more components. For example, the bar might show the total population of children in the age-group of 6–14 years. The components show the proportion of those who are enrolled and those who are not. A component bar diagram might also contain different component bars for boys, girls and the total of children in the given age group range, as shown in given figure.
|