CUET Preparation Today
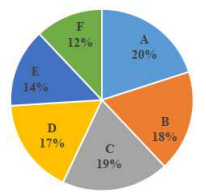
Study the given pie chart and table and answer the question that follows. The pie chart represents the percentage-wise distribution of 300 students of class X in a school in six different sections A, B, C, D, E and F.
The table shows the number of boys of class X in six different sections A, B, C, D, E and F.
The difference between the central angles of the sectors corresponding to the sections A and F is: |
28.4° 38.8° 26.8° 28.8° |
28.8° |
difference between the central angles of the sectors corresponding to the sections A and F = \(\frac{20 - 12 }{100}\) × 360º = \(\frac{8 }{100}\) × 360º = 28.8º |