CUET Preparation Today
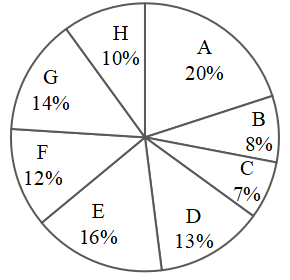
The pie chart given below shows the number of cars sold by 8 different companies. The total number of car sold by all these 8 companies are 10,000. Number of cars sold by a particular company is shown as a percent of total number of cars sold by all these 8 companies.
Which of the following statement is correct? I. The average number of cars sold by company B, F and H are 100. II. The ratio of number of cars sold by A to the number of cars sold by E are 4 : 5. |
Only I Only II Neither I nor II Both I and II |
Neither I nor II |
I. The average number of cars sold by company B, F and H are 100. Total cars sold by B , F & H = ( 8% + 10% + 12% ) of 10000 = 30% of 10000 = 3000 Average = \(\frac{3000}{3}\) = 1000 Statement 1 is not followed II. The ratio of number of cars sold by A to the number of cars sold by E are 4 : 5. Ratio of cars sold by A to cars sold by E = 20% of 10,000 : 16% of 10,000 = 5 : 4 Statement 2 is not followed Ans:- Neither I nor II |