CUET Preparation Today
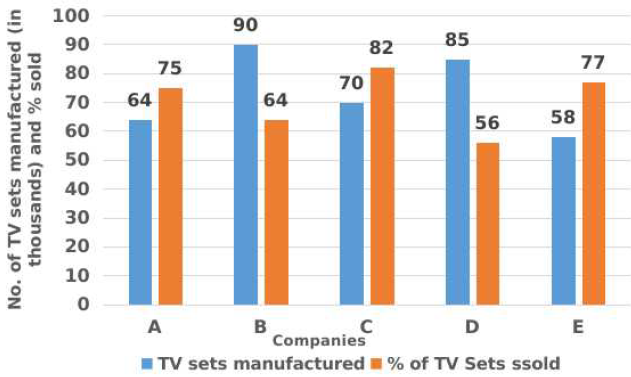
The given bar chart represents the number of Televisions Sets (TV) manufactured (in thousands) and the respective percentage of those TV Sets sold by five different companies A, B, C, D and E in 2015. Study the chart carefully and answer the question that follows.
The average number of TV sets sold by companies C and D is what percentage of the number of TV sets manufactured by company E? Express your answer correct to one place of decimal. |
86.5% 92.2% 90.5% 89.1% |
90.5% |
TV sold by C & D = \(\frac{82}{100}\) × 70 + \(\frac{56}{100}\) × 85 = 57.4 + 47.6 = 105 Average of TV sold by C & D = \(\frac{105}{2}\) = 52.5 TV sets manufactured by E = 58 Required percentage = \(\frac{52.5}{58}\) × 100 = 90.5% |