CUET Preparation Today
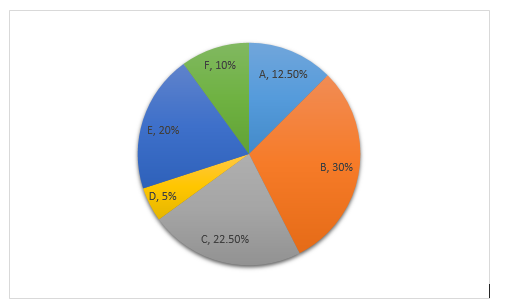
The pie-chart shows the annual car production (percentage wise) of six countries A, B, C, D, E and F. Study the pie chart and answer the question.
Total number of cars produced = 40,00,000 The number of cars produced by country B is what percent more than produced by country E? |
60% 25% 40% 50% |
50% |
Number of cars produced by country B = 30% Number of cars produced by country E = 20% Required percentage = \(\frac{30 - 20 }{20 }\) × 100 = \(\frac{10 }{20 }\) × 100 = 50% |